12 Code Once, Run Twice: Creating Your Own Functions
Bruno Rodrigues, head of the Department of Statistics and Data Strategy at the Ministry of Higher Education and Research in Luxembourg, is an avid R user. The same, however, cannot be said for all of his teammates. So Rodrigues needed a way to be able to easily share data with his non-R-user colleagues. Being the avid R user that he is, he wrote some R code to help him with this task. Specifically, he wrote a function called show_in_excel() that would take data from R, save it as a CSV file, and open the CSV file in Excel (we’ll explore it in depth below). From then on, whenever he needed to have his data in a CSV to share with colleagues, he could run his function and share away.
Rodrigues made this function to avoid having to copy the code from one project to the next. Of course, he could have just copied it over each time he started a new project, but that wouldn’t be an efficient strategy. Hadley Wickham, developer of the tidyverse set of packages, recommends creating a function once you’ve copied code three times. Working in this way, if Rodrigues ever wanted to tweak his function, he’d only have to make changes in one place. Creating functions makes it much easier to maintain and improve your code over time.
In this chapter, we’ll talk about how to make your own R functions. You’ll learn how functions work by seeing Bruno Rodrigues’s show_in_excel() function as well as two functions that I’ve created. By the end of the chapter, you’ll be ready to start making your own functions.
How Functions Work
Let’s go back to the show_in_excel() function that Bruno Rodrigues created (I’ll be using a slightly simplified version of it throughout the chapter). We begin by loading the tidyverse and fs packages. We’ll use the tidyverse, which you’ve seen throughout this book, to create a file name and save our CSV. The fs package will enable us to open the CSV file in Excel (or whichever program your computer uses to open CSV files by default).
Functions have three pieces:
- Name
- Body
- Arguments
Before we look at the show_in_excel() function, let’s look at a slightly altered version to help us understand how functions work. This function, called show_in_excel_penguins() opens the data on penguins that we saw in 6 in Excel. We begin by importing the data with the read_csv() function before creating the show_in_excel_penguins() function.
penguins <- read_csv("https://data.rwithoutstatistics.com/penguins-2007.csv")

show_in_excel_penguins <- function() {

  csv_file <- str_glue("{tempfile()}.csv")

  write_csv(x = penguins,
            file = csv_file,
            na = "")

  file_show(path = csv_file)

}
To understand how our function works, let’s look at the first line. In this line, we begin by naming our function show_in_excel_penguins. We next use the assignment operator (<-) and function() to specify that show_in_excel_penguins is not a variable name, but a function name. There’s an open curly bracket ({) at the end of the line, which indicates the start of the function body.
show_in_excel_penguins <- function() {The meat of the function can be found in its body. This is all of the code in between the open and closed curly brackets.
show_in_excel_penguins <- function() {

  # Function body goes here

}
In the case of the show_in_excel_penguins() function we’ve created, the body does three things:
Creates a location for a CSV file to be saved using the
str_glue()function combined with thetempfile()function. This creates a file a temporary location with the .csv extension and saves it ascsv_file.Writes
penguins(thexargument inwrite_csv()refers to the data frame to be saved) to the location set incsv_file. We also make all NA values show up as blanks (by default, they will show up as the text “NA”).Uses the
file_showfunction from thefspackage to open the CSV file in Excel.
csv_file <- str_glue("{tempfile()}.csv")

write_csv(x = penguins,
          file = csv_file,
          na = "")

file_show(path = csv_file)
If you wanted to use the show_in_excel_penguins() function, you would run the lines where you define the function. From there on out, any time you run the code show_in_excel_penguins(), R will open up the penguins data frame in Excel.
Now, you’re probably thinking: that doesn’t seem like the most useful function. Why would I want to keep opening up the penguins data frame? You wouldn’t, of course. To make your function more useful, we need to add arguments. Below is the actual code that Bruno Rodrigues used (again, modified ever so slightly for simplicity). Everything looks the same as our show_in_excel_penguins() function with one exception: the first line now says function(data). Items listed within the parentheses of our function definition are arguments. If you look further down, you’ll see one other change. Within write_csv(), instead of x = penguins, we now have x = data. This allows us to use the function with any data, not just penguins.
show_in_excel <- function(data) {

  csv_file <- str_glue("{tempfile()}.csv")

  write_csv(x = data,
            file = csv_file,
            na = "")

  file_show(path = csv_file)

}
To use this function, you tell show_in_excel() what data to use and the function will open it in Excel. You can tell it to open the penguins data frame as follows:
show_in_excel(data = penguins)But, having created the function with the data argument, we can run it with any data we want to. This code, for example, will import COVID case data we saw in Chapter 9 and open it in Excel.
covid_data <- read_csv("https://data.rwithoutstatistics.com/us-states-covid-rolling-average.csv")

show_in_excel(data = covid_data)
You can also use this function in a pipeline. This code filters the covid_data data frame to only include data from California before opening it in Excel.
Bruno Rodrigues could have copied the code within the show_in_excel() function and re-run it every time he wanted to view his data in Excel. But, by creating a function, he creates the code once and can run it as many times as necessary.
Creating a ggplot Theme Function
In the show_in_excel() function, nothing is changed within R; it simply allows us to view data in Excel. A more typical use case is to create a function that you use while working in R to do something to your data or, in the case below, plots. A common example is creating your own ggplot theme.
We’ve seen ggplot themes in Chapters 2 and 4, but these uses were one-offs. Chapter 3 showed how the BBC made a custom theme to be used across projects. This multi-project use case shows the value of creating a function. Rather than copying your ggplot theme code from one project to the next, you can create it once and use it across all projects.
Below, we can see a custom theme that I’ve created for myself. Called theme_dk(), this function sets the defaults that I like to use in my plots, including removing axis ticks, adjusting the font size of axis titles as well as the plot title and subtitle, and putting the legend above the plot and increasing its font size.
theme_dk <- function(show_grid_lines = TRUE,
                     show_axis_titles = TRUE) {

  custom_theme <- theme_minimal() +
    theme(panel.grid.minor = element_blank(),
          axis.ticks = element_blank(),
          axis.title = element_text(size = 12,
                                   color = "grey50"),
          axis.title.x = element_text(margin = margin(t = 10)),
          axis.title.y = element_text(margin = margin(r = 10)),
          axis.text = element_text(size = 12,
                                   color = "grey50"),
          plot.title.position = "plot",
          plot.title = element_text(size = 20,
                                    face = "bold",
                                    margin = margin(b = 8)),
          plot.subtitle = element_text(size = 14,
                                       color = "grey50"),
          legend.text = element_text(size = 12),
          legend.position = "top")

  if (show_grid_lines == FALSE) {

    custom_theme <- custom_theme +
      theme(panel.grid.major = element_blank())

  }

  if (show_axis_titles == FALSE) {

    custom_theme <- custom_theme +
      theme(axis.title = element_blank(),
            axis.title.x = element_blank(),
            axis.title.y = element_blank())

  }

  custom_theme

}
I can then apply my theme as you would any other ggplot theme.
penguins %>%
  ggplot(aes(x = bill_length_mm,
             y = bill_depth_mm,
             color = island)) +
  geom_point() +
  labs(title = "A histogram of bill length and bill depth",
       subtitle = "Data from palmerpenguins package",
       x = "Bill Length",
       y = "Bill Depth",
       color = NULL) +
  theme_dk()
In Figure 12.1 below, we can see what a histogram made with theme_dk() looks like using the same penguins data.
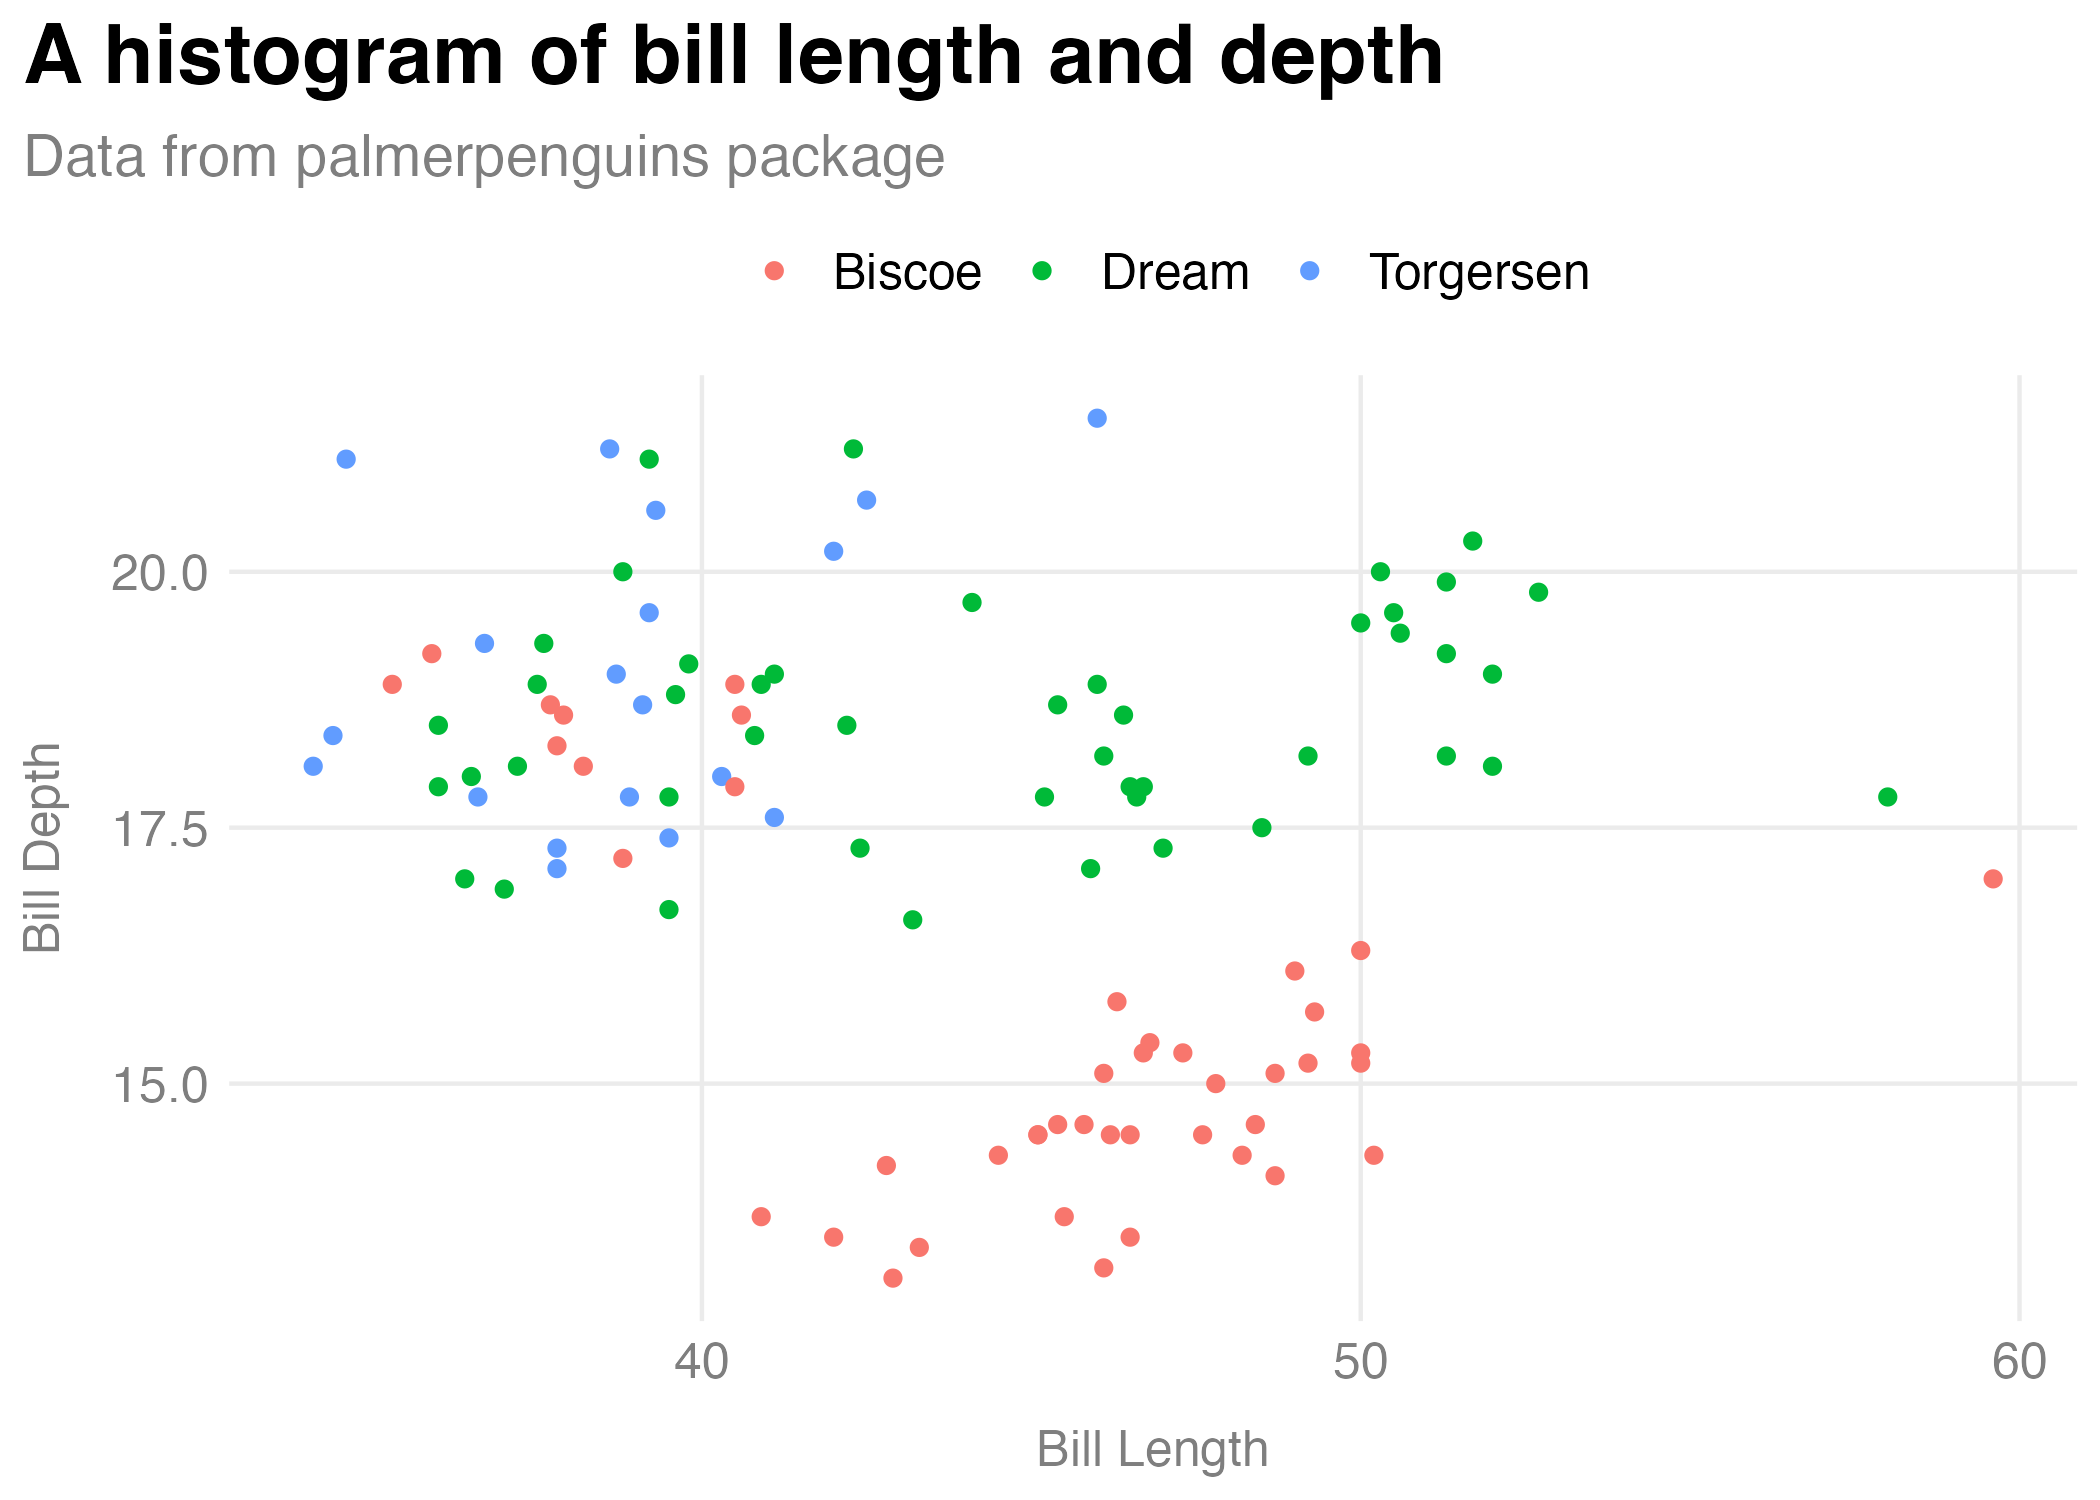
Figure 12.1: A histogram made with my custom theme
Let’s now discuss how the custom ggplot theme function works. The first three lines define our function and provide two arguments: show_grid_lines and show_axis_titles. Whereas the data argument in show_in_excel() required us to give the function data, the arguments in theme_dk() have defaults built in. The lines show_grid_lines = TRUE and show_axis_lines = TRUE mean that grid lines and axis titles will be visible on our plot by default.
The first piece of the code in theme_dk() starts with theme_minimal() (for more on the specifics refer to how the bbc_style() function was created in Chapter 3). The changes that are then made with the theme() function are saved as an object called custom_theme.
custom_theme <- theme_minimal() +
  theme(panel.grid.minor = element_blank(),
        axis.ticks = element_blank(),
        axis.title = element_text(size = 12,
                                  color = "grey50"),
        axis.title.x = element_text(margin = margin(t = 10)),
        axis.title.y = element_text(margin = margin(r = 10)),
        axis.text = element_text(size = 12,
                                 color = "grey50"),
        plot.title.position = "plot",
        plot.title = element_text(size = 20,
                                  face = "bold",
                                  margin = margin(b = 8)),
        plot.subtitle = element_text(size = 14,
                                     color = "grey50"),
        legend.text = element_text(size = 12),
        legend.position = "top")
One difference between theme_dk() and bbc_style() is that theme_dk() gives a bit more flexibility. I do this using two if statements. While I defined the default plot to show grid lines and axis titles, if the user sets the show_grid_lines and show_axis_titles arguments to FALSE, those elements will be removed. The if statements test whether show_grid_lines and show_axis_titles are set to TRUE. If so, it changes the custom_theme object. At the end of the function, we do what’s called returning an object. In this case, we return the custom_theme object, meaning that custom_theme, with or without our changes to grid lines and axis titles is returned, making it available to use in our plot.
To show an example of when we might want to remove grid lines and axis titles, I’ll create a simple bar chart of the number of penguins on each island.
penguins %>%
  count(island) %>%
  ggplot(aes(x = island,
             y = n)) +
  geom_col() +
  labs(title = "Number of penguins on each island",
       subtitle = "Data from palmerpenguins package") +
  theme_dk(show_grid_lines = FALSE,
           show_axis_titles = FALSE)
When I use theme_dk() here, I set show_grid_lines and show_axis_titles to FALSE, removing those elements from our chart. We can see the result in Figure 12.2.
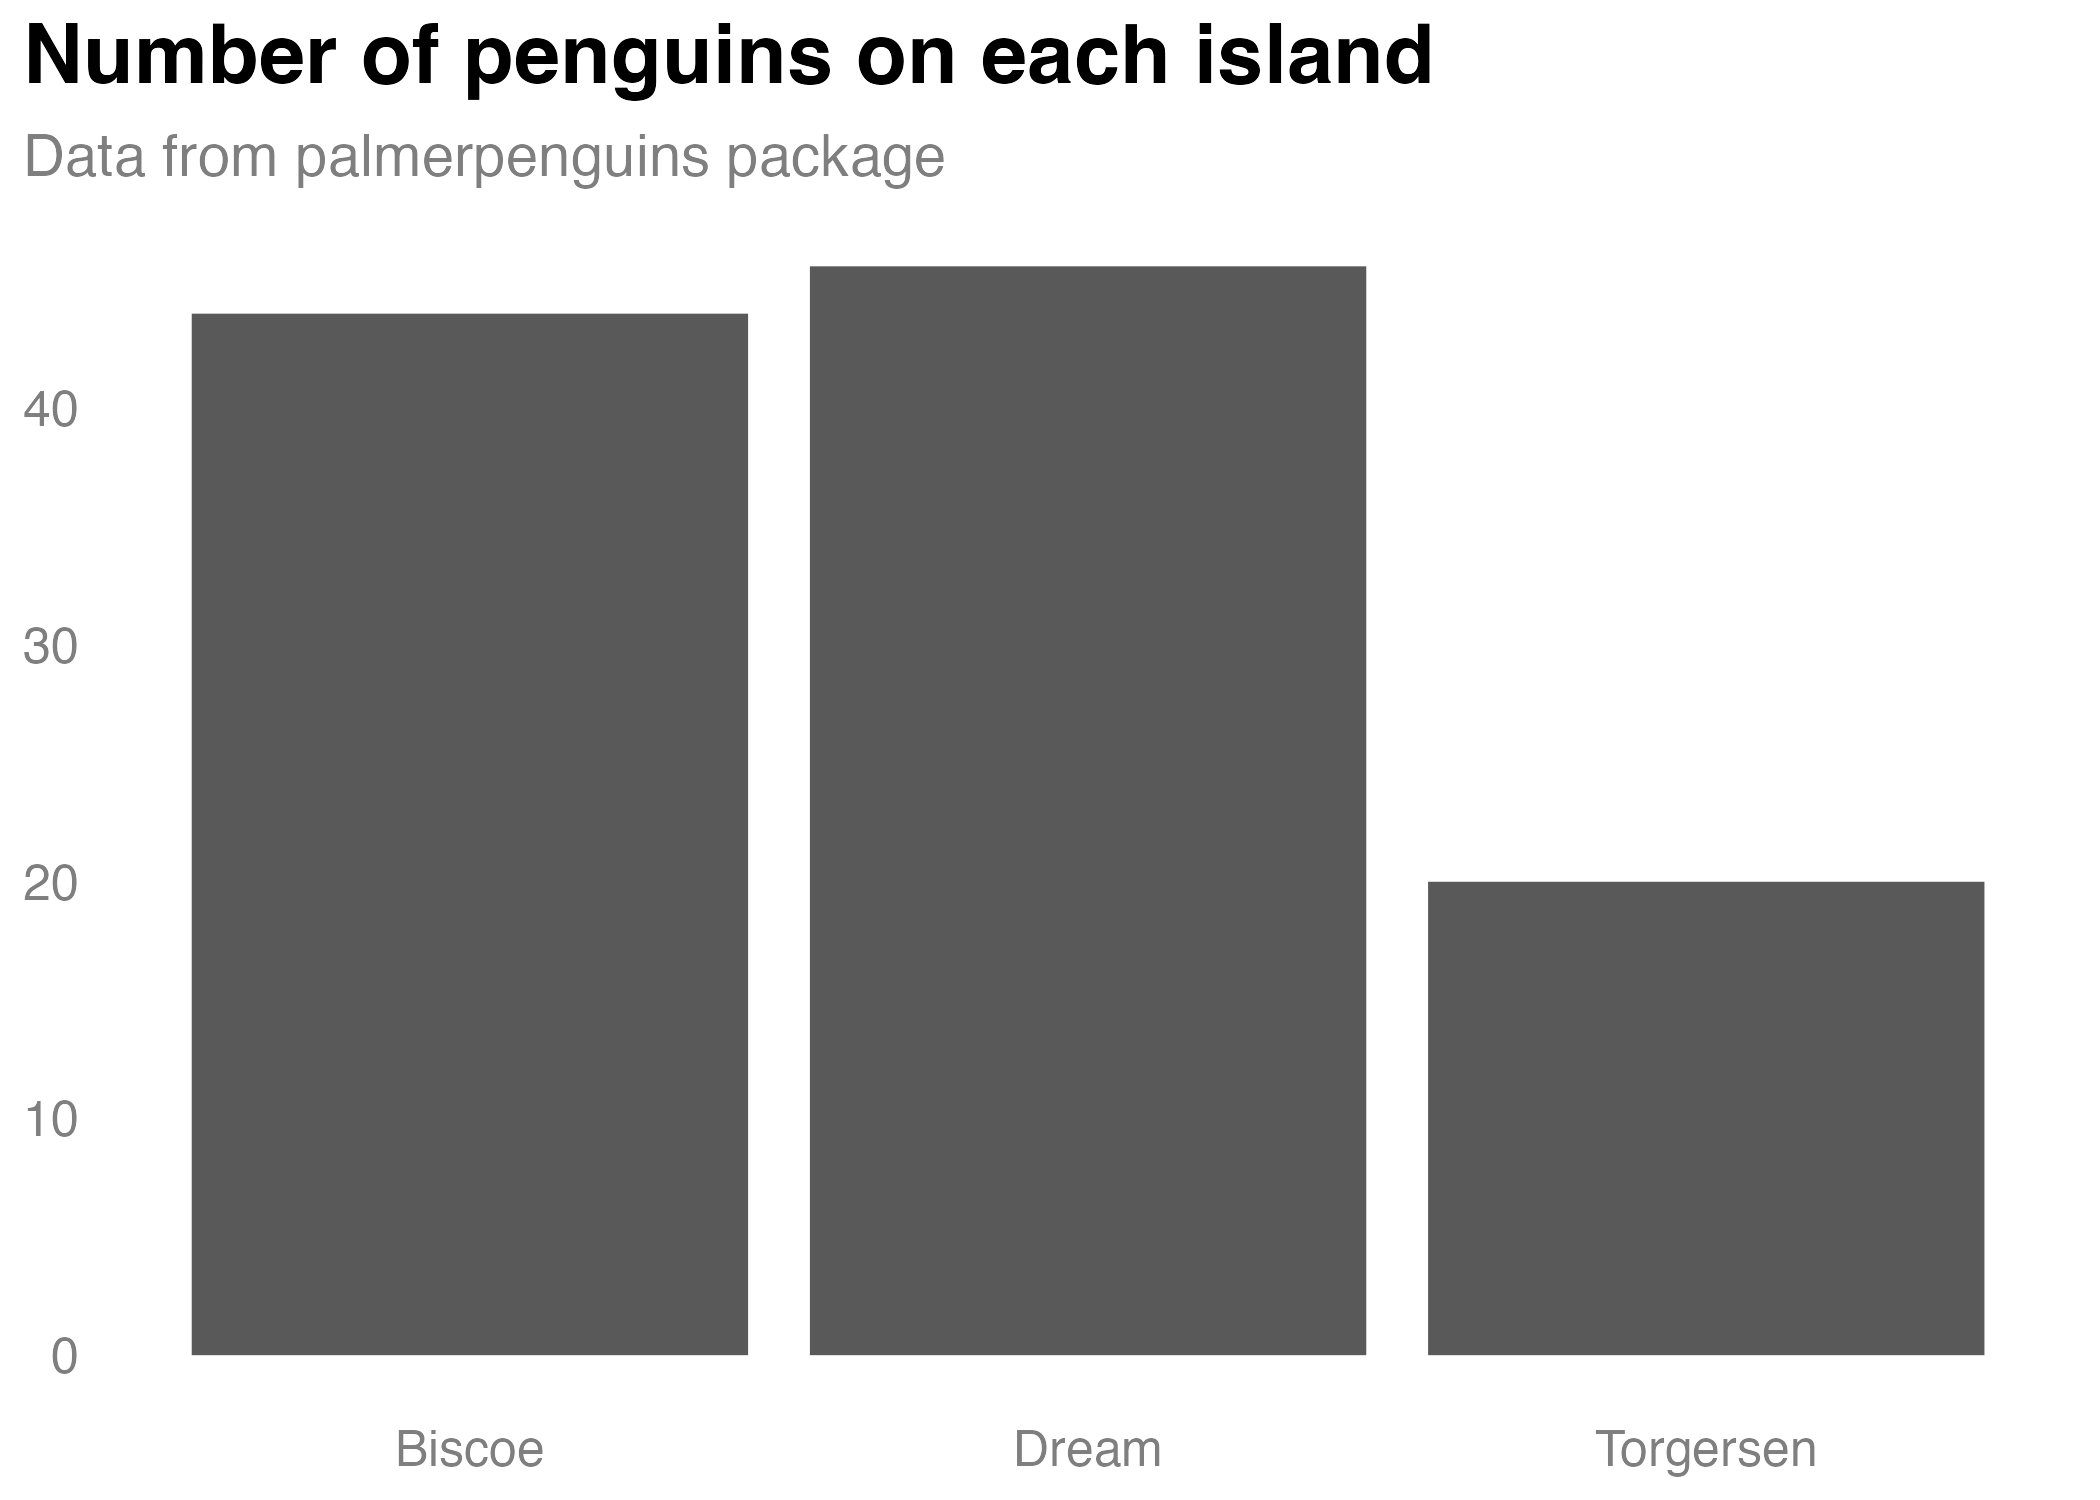
Figure 12.2: A bar chart using my custom theme
Creating a function with default arguments allows us to set the options that we are most likely to want, while also giving us flexibility to change the arguments each time we use the function.
Creating a Function to Automatically Format Race and Ethnicity Data
Let’s take a look at one more custom function that I’ve created. As we saw in Chapter 11, we can use the tidycensus package to easily pull in data directly from the United States Census Bureau. As we also saw in that same chapter, it can be hard to remember the names of variables. I regularly want to access data on population by race and ethnicity from the American Community Survey, but I never remember which variables I need to access to do so. I’ve created the get_acs_race_ethnicity() function below to help me.
library(tidycensus)

get_acs_race_ethnicity <- function(...) {

  get_acs(...,
          variables = c("White" = "B03002_003",
                        "Black/African American" = "B03002_004",
                        "American Indian/Alaska Native" = "B03002_005",
                        "Asian" = "B03002_006",
                        "Native Hawaiian/Pacific Islander" = "B03002_007",
                        "Other race" = "B03002_008",
                        "Multi-Race" = "B03002_009",
                        "Hispanic/Latino" = "B03002_012"))

}
Much of the code in this function will look familiar: it uses the get_acs() function to bring in data. And it gives names to the variables (for example, “Asian” instead of “B03002_006”). But the novel piece is the ... (pronounced “dot-dot-dot”) used within function() and within get_acs(). To explain what this is, let’s talk about why it exists. I created the get_acs_race_ethnicity() function to do two things:
Bring in data on population by race and ethnicity.
Give my variables more meaningful names.
What get_acs_race_ethnicity() does not do is determine the geography needed. Do I want this data at the state level, say, the county level, or the Census tract level? I could add an argument for this, but I’d just be recreating arguments that already exist in the get_acs() function. See below for what this would look like.
get_acs_race_ethnicity <- function(my_geography) {

  get_acs(geography = my_geography,
          variables = c("White" = "B03002_003",
                        "Black/African American" = "B03002_004",
                        "American Indian/Alaska Native" = "B03002_005",
                        "Asian" = "B03002_006",
                        "Native Hawaiian/Pacific Islander" = "B03002_007",
                        "Other race" = "B03002_008",
                        "Multi-Race" = "B03002_009",
                        "Hispanic/Latino" = "B03002_012"))

}
As we saw in Chapter 11, the get_acs() function has many arguments. I don’t want to repeat them all as arguments in my get_acs_race_ethnicity() function. The ... allows us to avoid doing so. By putting ... in the get_acs_race_ethnicity() function, any arguments listed there are then passed to the get_acs() function (note the ... there as well). I can then run this code to set the geography to state.
get_acs_race_ethnicity(geography = "state")Which would return the following:
#> # A tibble: 416 × 5
#> GEOID NAME variable estim…¹ moe
#> <chr> <chr> <chr> <dbl> <dbl>
#> 1 01 Alabama White 3192147 1410
#> 2 01 Alabama Black/African American 1292950 2796
#> 3 01 Alabama American Indian/Alaska Native 21297 1050
#> 4 01 Alabama Asian 67317 1384
#> 5 01 Alabama Native Hawaiian/Pacific Isla… 1887 317
#> 6 01 Alabama Other race 9779 1312
#> 7 01 Alabama Multi-Race 94858 3378
#> 8 01 Alabama Hispanic/Latino 212951 536
#> 9 02 Alaska White 439979 831
#> 10 02 Alaska Black/African American 22720 999
#> # … with 406 more rows, and abbreviated variable name
#> # ¹estimateI could run my get_acs_race_ethnicity() function again and add geometry = TRUE as follows.
get_acs_race_ethnicity(geography = "state",
                       geometry = TRUE)
My get_acs_race_ethnicity() function will now return geospatial data alongside my demographic data.
#> Simple feature collection with 416 features and 5 fields
#> Geometry type: MULTIPOLYGON
#> Dimension:     XY
#> Bounding box:  xmin: -179.1489 ymin: 17.88328 xmax: 179.7785 ymax: 71.36516
#> Geodetic CRS:  NAD83
#> First 10 features:
#>    GEOID        NAME                         variable
#> 1     35  New Mexico                            White
#> 2     35  New Mexico           Black/African American
#> 3     35  New Mexico    American Indian/Alaska Native
#> 4     35  New Mexico                            Asian
#> 5     35  New Mexico Native Hawaiian/Pacific Islander
#> 6     35  New Mexico                       Other race
#> 7     35  New Mexico                       Multi-Race
#> 8     35  New Mexico                  Hispanic/Latino
#> 9     72 Puerto Rico                            White
#> 10    72 Puerto Rico           Black/African American
#>    estimate  moe                       geometry
#> 1    769139 1774 MULTIPOLYGON (((-109.0502 3...
#> 2     37975 1007 MULTIPOLYGON (((-109.0502 3...
#> 3    179881 1583 MULTIPOLYGON (((-109.0502 3...
#> 4     31328  853 MULTIPOLYGON (((-109.0502 3...
#> 5      1408  312 MULTIPOLYGON (((-109.0502 3...
#> 6      5934  977 MULTIPOLYGON (((-109.0502 3...
#> 7     39568 2313 MULTIPOLYGON (((-109.0502 3...
#> 8   1031788   NA MULTIPOLYGON (((-109.0502 3...
#> 9     31715 1746 MULTIPOLYGON (((-65.23805 1...
#> 10     3214  494 MULTIPOLYGON (((-65.23805 1...
The ... allows me to create my own function and pass any arguments from it to another function without repeating all of the child function’s arguments, giving me flexibility while maintaining brevity.
Conclusion
In this chapter, we’ve seen how you can create your own functions to avoid having to copy and paste code over and over. Creating a function allowed Bruno Rodrigues to be able to easily open data in Excel. And I myself have written code that gives me me a custom ggplot theme and a function to easily import race and ethnicity data from the American Community Survey. All of these functions are things that Bruno or I might have otherwise copied across multiple projects. Creating a function lets us create them once and use them across projects.
When I started working in R, I saw functions as code that other people created that made my life easier. With time, I came to realize that there is nothing special about functions created by others. Because R is an open source language, anyone can create functions to do things they need to do, including me. Sometimes those things are small (like my function to access race and ethnicity data from the ACS). Other times, they’re larger (like my custom ggplot theme). No matter how big they are, functions that you create can have a huge improvement on your coding efficiency.